by Olga Filippova
In this blog article we will recall the most interesting results of Elphel participation at CVPR 2018 Expo, the conversations we had with visitor’s at the booth, FAQs as well as unusual questions, and what we learned from it. In
The Expo lasted from June 19-21, and each day had it’s own focus and results, so this article is organized chronologically.
Day One: The best show ever!
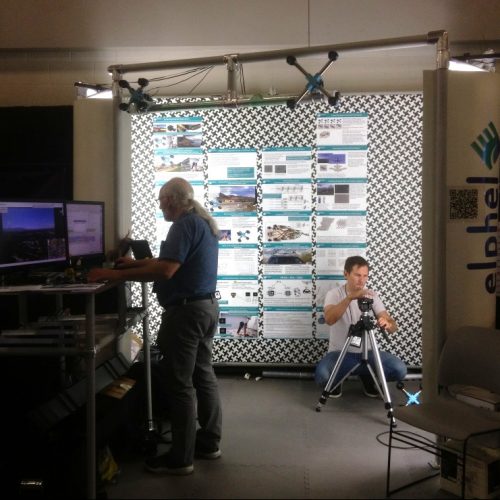
June 19, CVPR 2018, booth 132
While we are standing nervously at our booth, thinking: “Is there going to be any interest? Will people come, will they ask questions?”, the first poster session starts and a wave of visitors floods the exhibition floor. Our first guest at the booth spends 30 minutes, knowledgeably inquiring about Elphel’s long-range 3D technology and leaves his business card, saying that he is very impressed. This was a good start of a very busy day full of technical discussions. CVPR is the first exhibition we have participated in where we did not have any problems explaining our projects.
The most common questions that were asked:
(more…)
by Andrey Filippov
We uploaded an image set with 2D correlation data together with the import Python code for experiments with the neural networks and are now looking for collaboration with those who would love to apply their DL experience to the new kind of input data. More data will follow and we welcome feedback to make this data set more useful.
The application area we are interested in is an extremely long distance 3D scene reconstruction and ranging with the distance to baseline ratio of 1000:1 to 10,000:1 while preserving wide field of view. Earlier post describes aircraft distance and velocity measurements with up to 3,000:1 distance-to-baseline ratio and 60°(H)×45°(V) field of view.
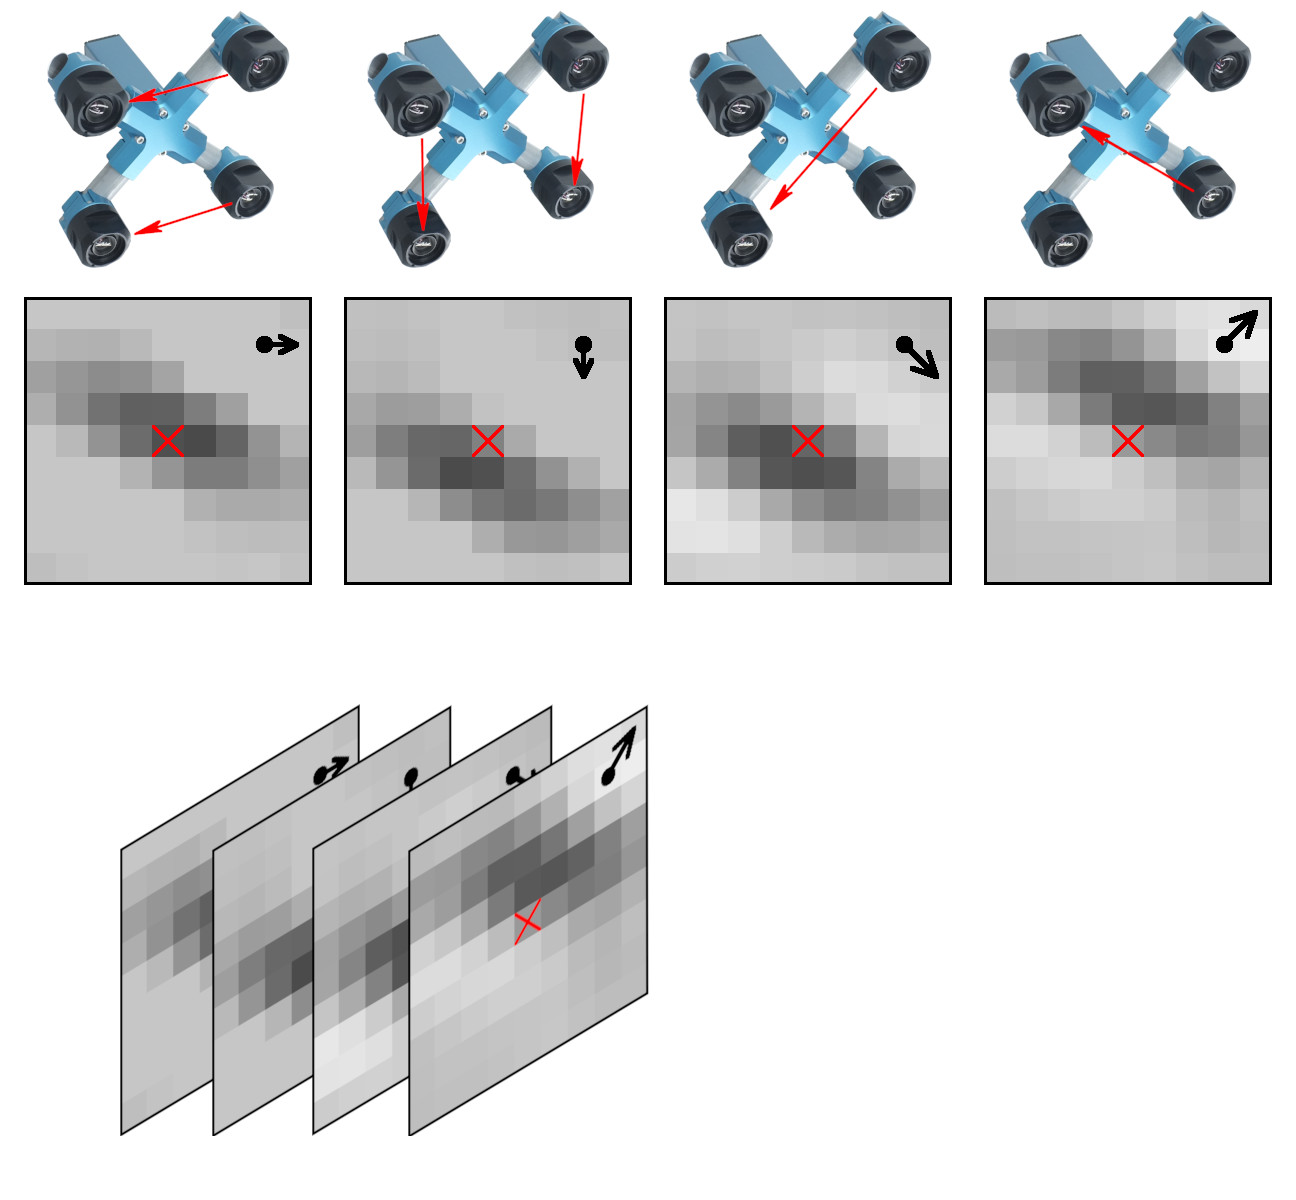
Figure 1. Space-invariant 2D phase correlation data
Data set: source images, 2D correlation tiles, and X3D scene models
The data set contains 2D phase correlation output calculated from the 2592×1936 Bayer mosaic source images captured by the quad stereo camera, and Disparity Space Image (DSI) calculated from a pair of such cameras. Longer baseline provides higher range resolution and this DSI is serving as the ground truth for a single quad camera. The source images as well as all the used software is also provided under the GNU/GPLv3 license. DSI is organized as a 324×242 array – each sample is calculated from the corresponding 16×16 tile. Tiles are overlapping (as shown in Figure 3) with stride 8.
These data sets are provided together with the fully reconstructed X3D scene models, viewable in the browser (Wavefront OBJ files are also generated). The scene models are different from the raw DSI as the next software stages generate meshes, and that frequently leads to over-simplification of the original DSI (so most fronto parallel objects in the scene provide better range accuracy when probed near the bottom). Each scene is accompanied with the multi-layer TIFF file (*-DSI_COMBO.tiff) that allows to see the difference between the measured DSI and the one used in the rendered X3D model. File format and Python import software is documented in Oleg’s post “Reading quad stereo TIFF image stacks in Python and formatting data for TensorFlow”, the data files are directly viewable with ImageJ.
(more…)
by Oleg Dzhimiev
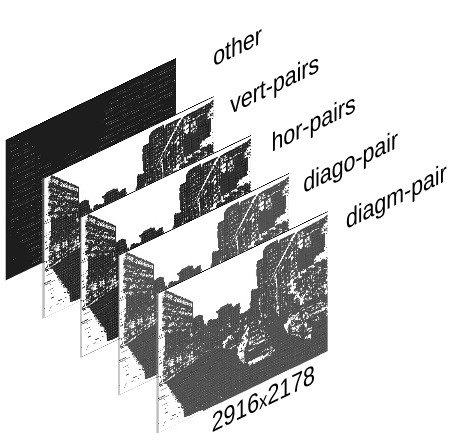
Fig.1 TIFF image stack
The input is a
<filename>.tiff – a TIFF image stack generated by ImageJ Java plugin (using
bioformats) with Elphel-specific information in ImageJ written TIFF tags.
Reading and formatting image data for the Tensorflow can be split into the following subtasks:
- convert a TIFF image stack into a NumPy array
- extract information from the TIFF header tags
- reshape/perform a few array manipulations based on the information from the tags.
To do this we have created a few Python scripts (see
python3-imagej-tiff:
imagej_tiff.py) that use Pillow, Numpy, Matplotlib, etc..
Usage:
~$ python3 imagej_tiff.py <filename>.tiff
It will print header info in the terminal and display the layers (and decoded values) using Matplotlib.
(more…)
