Lens testing at Elphel
We were measuring lens performance since we’ve got involved in the optical issues of the camera design. There are several blog posts about it starting with "Elphel Eyesis camera optics and lens focus adjustment". Since then we improved methods of measuring Point Spread Function (PSF) of the lenses over the full field of view using the target pattern modified from the standard checkerboard type have better spatial frequency coverage. Now we use a large (3m x 7m) pattern for the lens testing, sensor front end (SFE) alignment, camera distortion calibration and aberration measurement/correction for Eyesis series cameras.
So far lens testing was performed for just two purposes – select the best quality lenses (we use approximately half of the lenses we receive) and to precisely adjust the sensor position and tilt to achieve the best resolution over the full field of view. It was sufficient for our purposes, but as we are now involved in the custom lens design it became more important to process the raw PSF data and convert it to lens parameters that we can compare against the simulated achieved during the lens design process. Such technology will also help us to fine-tune the new lens design requirements and optimization goals.
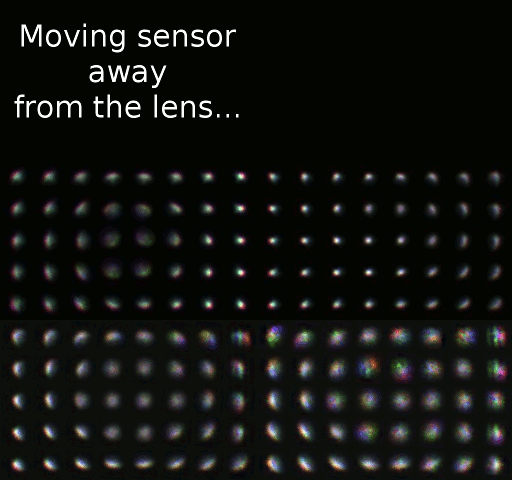
The starting point was the set of the PSF arrays calculated using images acquired from the the pattern while scanning over the range of distances from the lens to the sensor in small increments as illustrated on the animated GIF image Fig.1. The sensor surface was not aligned to be perpendicular to the optical axis of the lens before the measurement -each lens and even sensor chip has slight variations of the tilt and it is dealt with during processing of the data (and during the final alignment of the sensor during production, of course). The PSF measurement based on the repetitive pattern gives sub-pixel resolution (1.1μm in our case with 2.2μm Bayer mosaic pixel period – 4:1 up-sampled for red and blue in each direction), but there is a limit on the PSF width that the particular setup can handle. Too far out-of-focus and the pattern can not be reliably detected. That causes some artifacts on the animations made of the raw data, these PSF samples are filtered during further processing. In the end we are interested in lens performance when it is almost in perfect focus, so scanning too far away does not provide much of the practical value anyway.
(more…)

